Displaying the Lightcurve of a Comet
Generating a lightcurve of a Comet
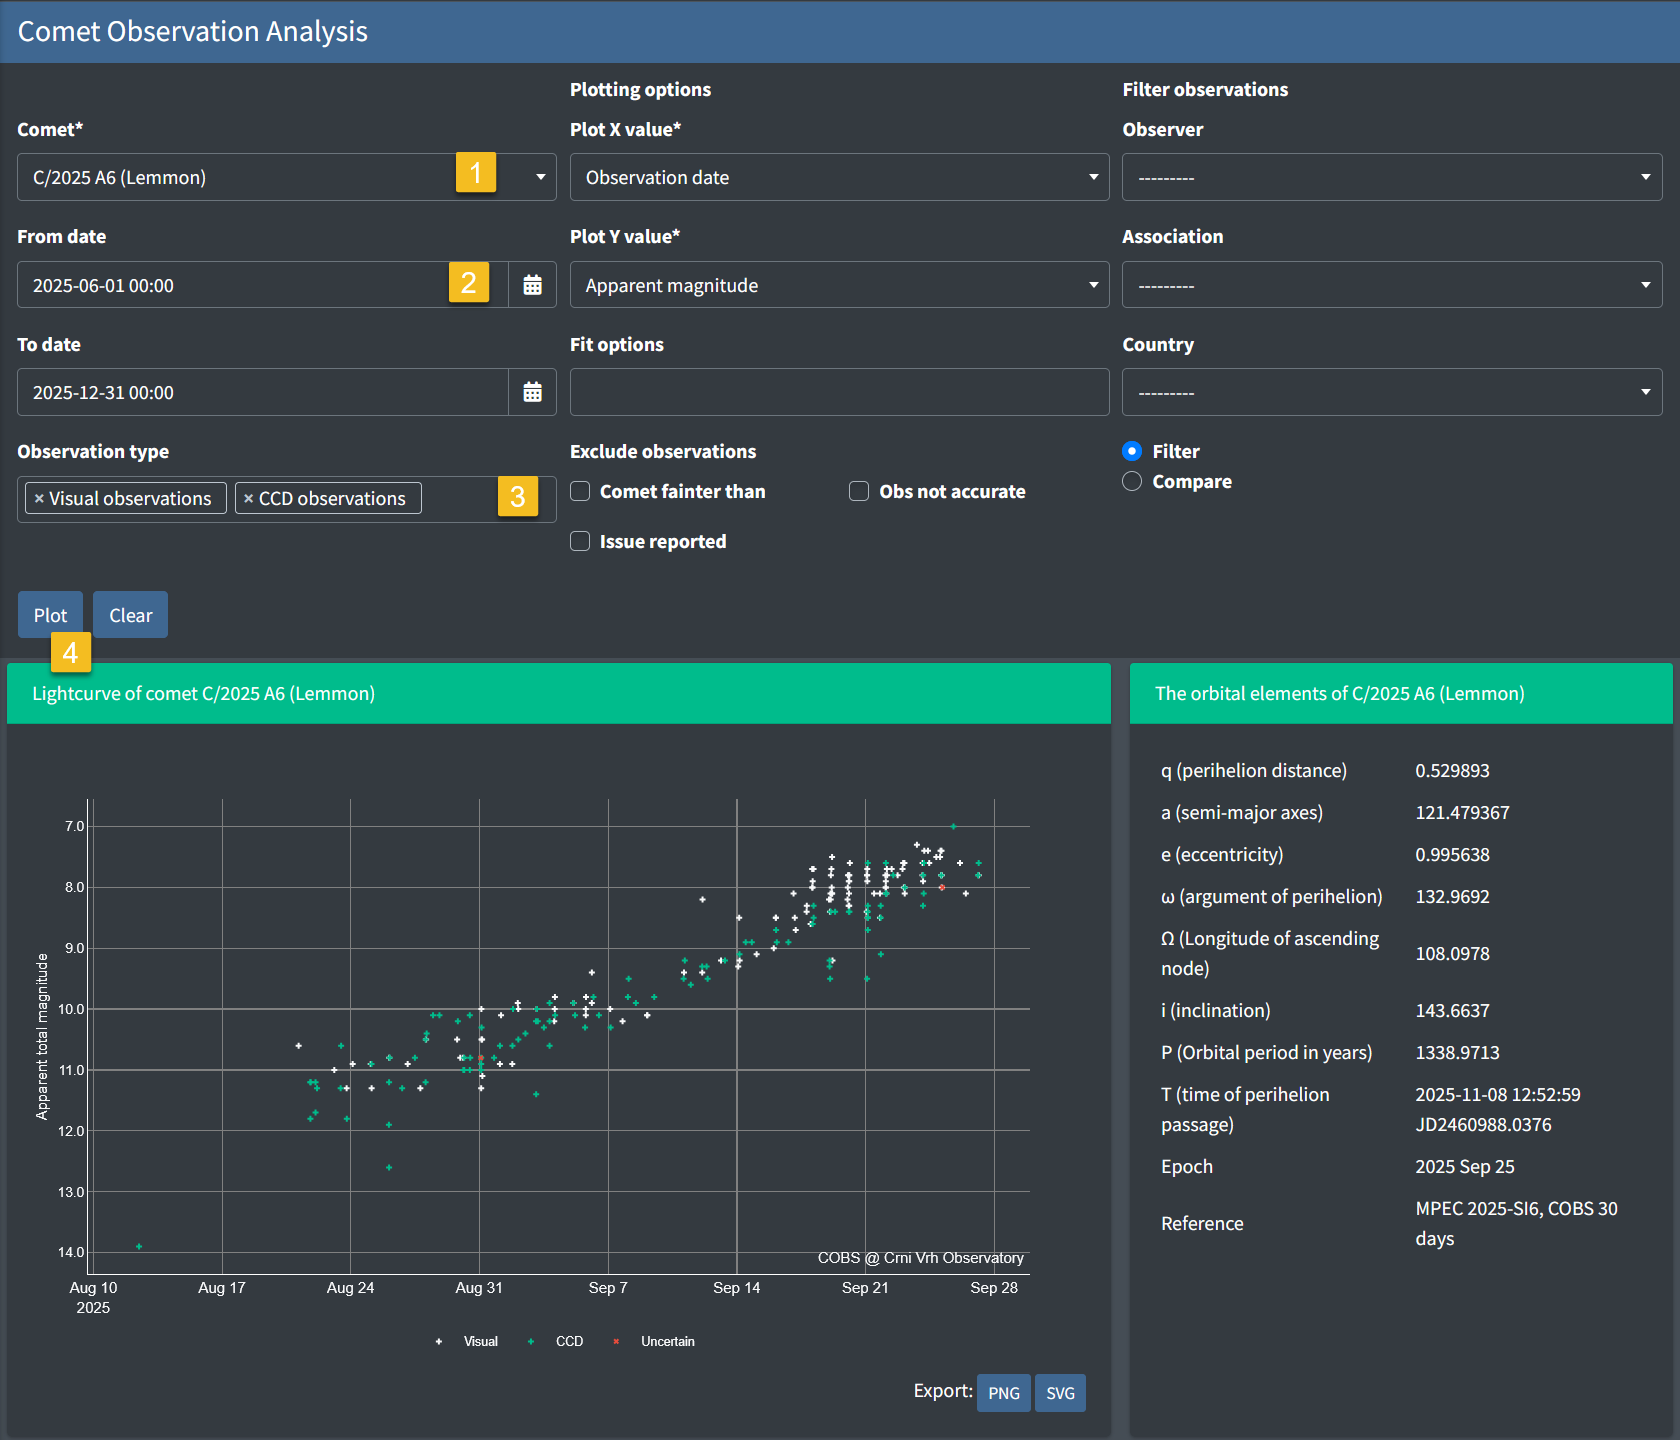
This page explains how to generate and interpret the lightcurve (or observation plot) for a comet using the available interface.
- Choose a Comet
- Use the Comet dropdown to search for and select the comet you want to analyze. - Select a Date Range (Optional)
- Enter values in From date and To date to restrict the data to a specific time window.
- If left empty, all available observations will be included.
⚠️ Note: If the entered dates fall outside the range of available observations, the plot will automatically display the full observation range instead. - Choose Observation Type(s)
- By default, both Visual observations and CCD observations are included.
- Deselect one of the options if you only want to analyze a specific type of observation. - Plot the Data
- Click Plot to generate the lightcurve (or observation plot).
- Each point on the chart represents a single observation.
Example:
Below is a screenshot of comet C/2025 A6 (Lemmon) with a date range applied:
Display Options for the Plot
You can customize which values are shown on the X-axis and Y-axis of the lightcurve plot.
X-Axis Options (Plot X value)
- Observation date – Standard calendar date of the observation.
- Time from perihelion – Relative time before or after the comet’s perihelion passage.
- Heliocentric distance – Comet’s distance from the Sun in astronomical units (AU).
Y-Axis Options (Plot Y value)
- Apparent magnitude – Observed brightness of the comet.
- Coma diameter – Apparent size of the comet’s coma.
- Coma DC – Degree of condensation of the coma.
- Tail length – Observed length of the comet’s tail.
- Tail PA – Tail position angle (orientation).
- Heliocentric magnitude
Fitting Options
You can overlay various calculated curves or markers on the plot to highlight trends. Select one or more options from Fit options:
- Brightness lightcurve (simple) – Standard lightcurve fit through magnitude observations.
- Brightness lightcurve (scatter) – Forward scatter fit through magnitude observations.
- Perihelion date – Vertical marker indicating the perihelion date.
- Current epoch – Vertical marker showing the present date.
- Heliocentric distance – Curve showing the comet distance from the Sun.
- Geocentric distance – Curve showing the comet distance from Earth.
- Elongation – Curve showing solar elongation (Sun–Earth–comet angle).
- Phase angle – Curve showing the phase angle (Sun–comet–Earth angle).
Examples:
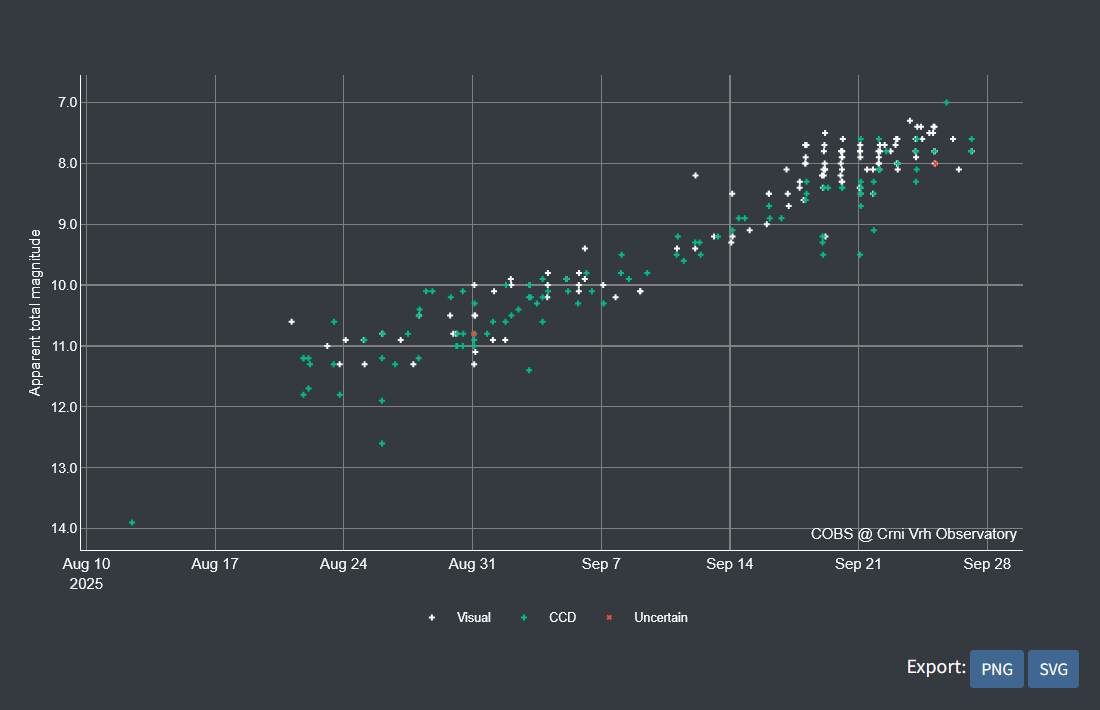
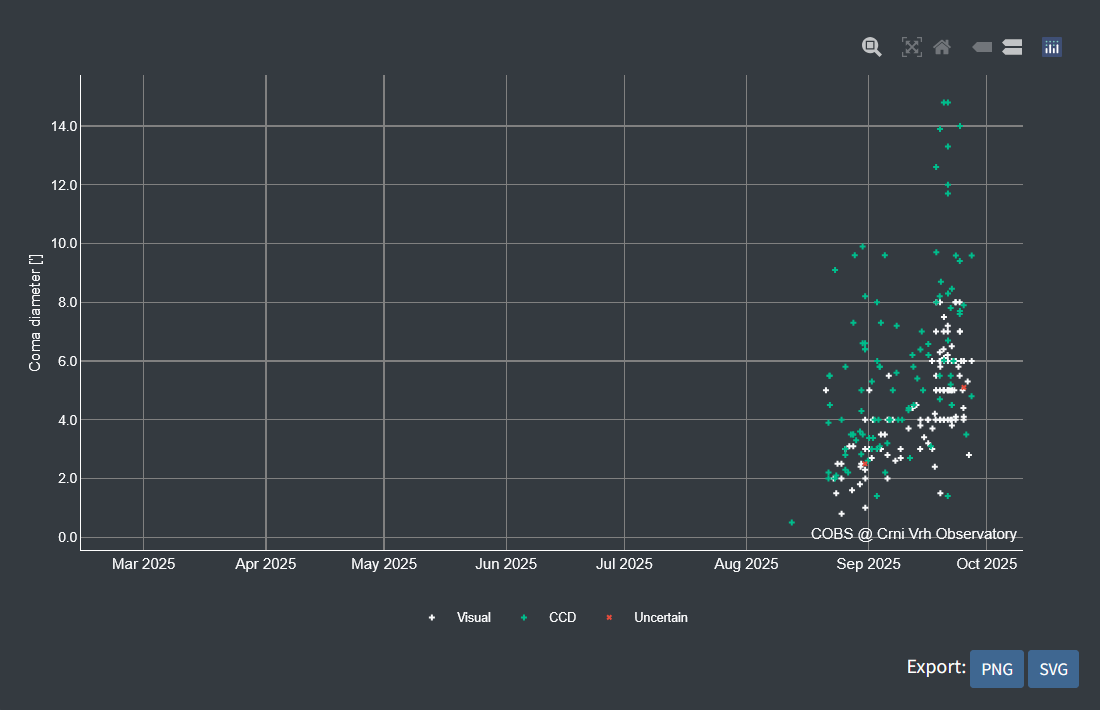
Figure 2. Coma diameter [′] of comet C/2023 A3 plotted against observation date.
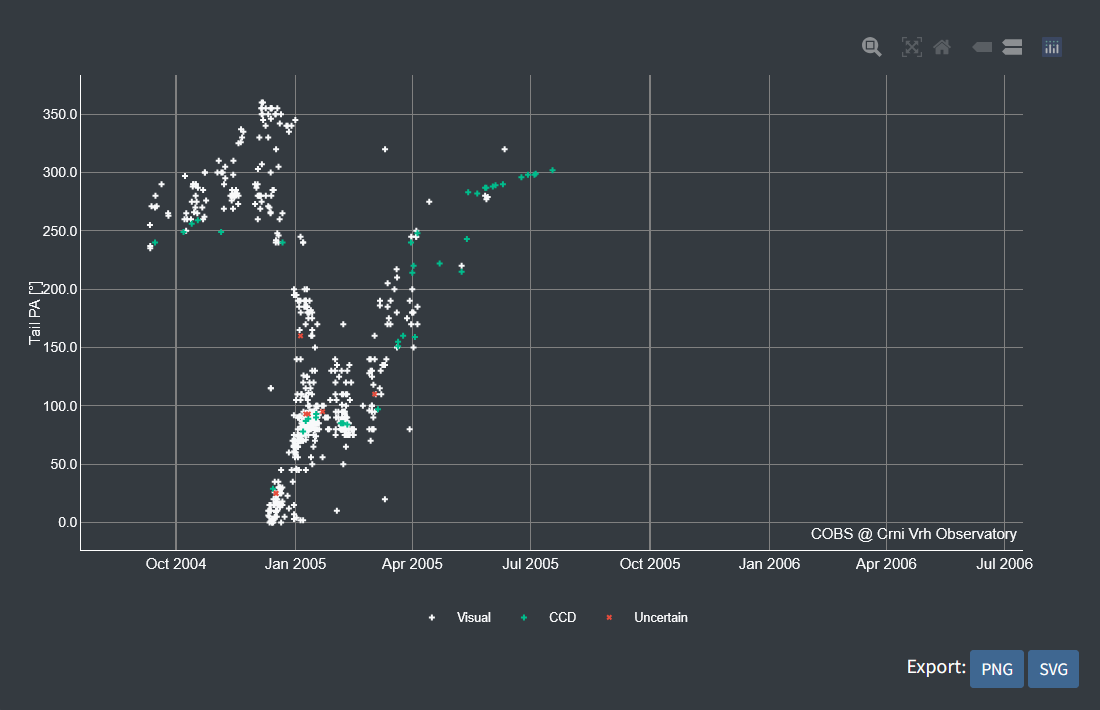
Figure 3. Change of tail position angle (PA) over time for comet C/2004 Q2 (Machholz).
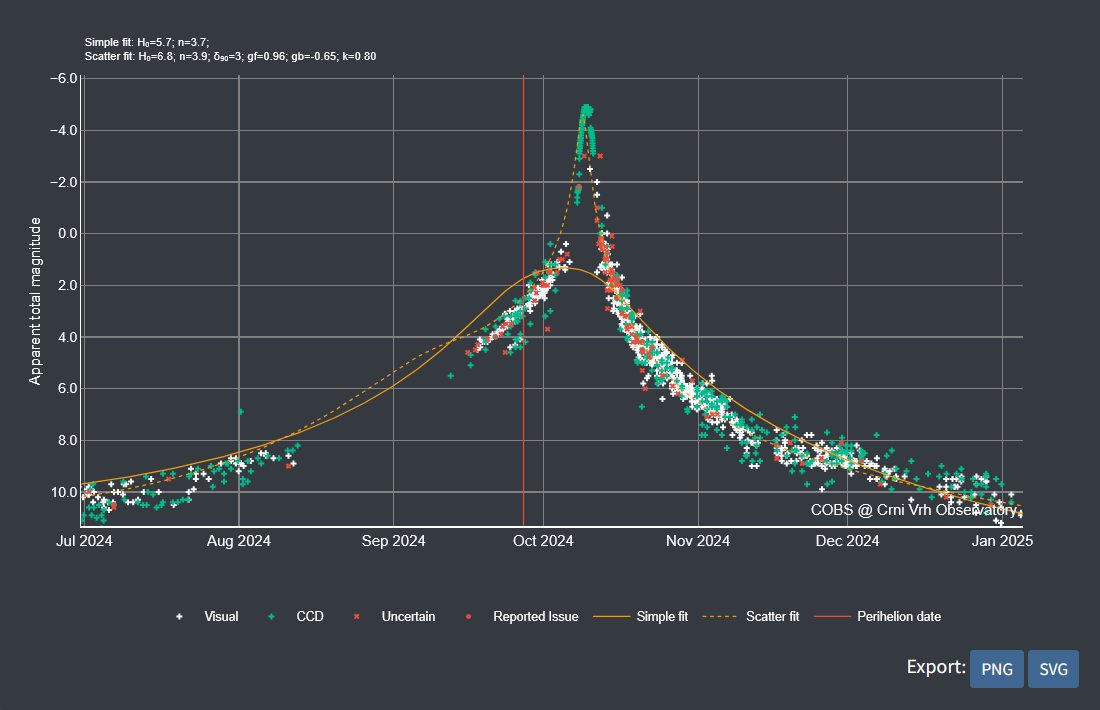
Figure 4. Comparison of simple vs. scatter lightcurve fits for observations of comet C/2023 A3 (Tsuchinshan–ATLAS).
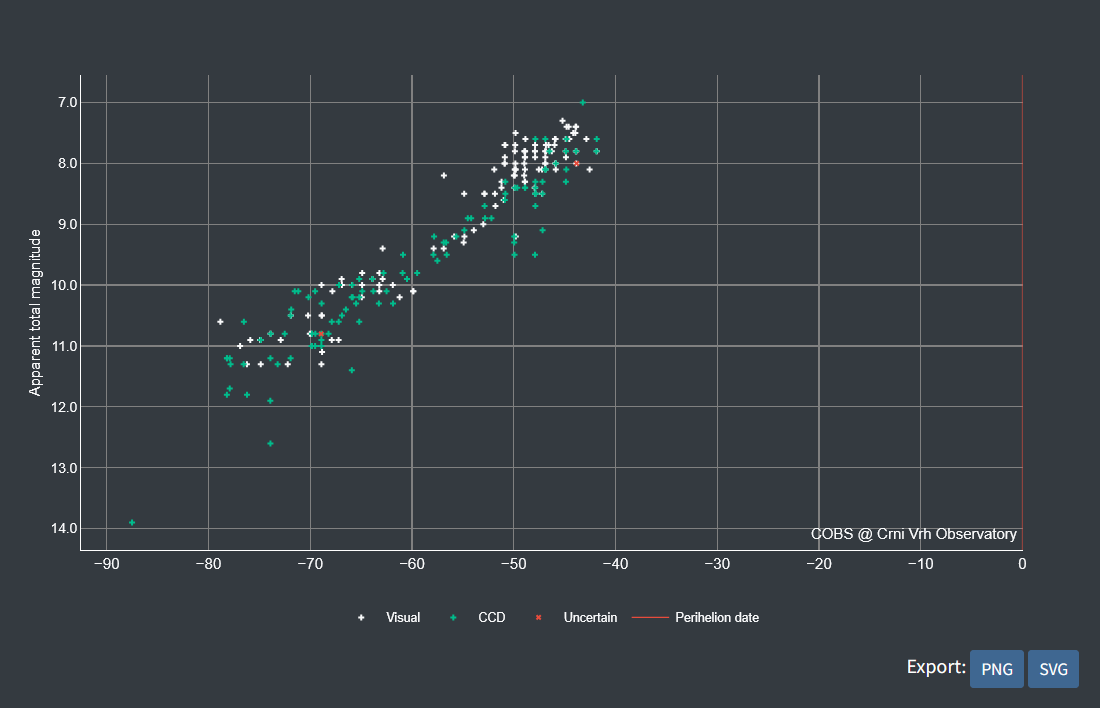
Figure 5. Observations of comet C/2025 A6 (Lemmon) plotted against time from perihelion [days].
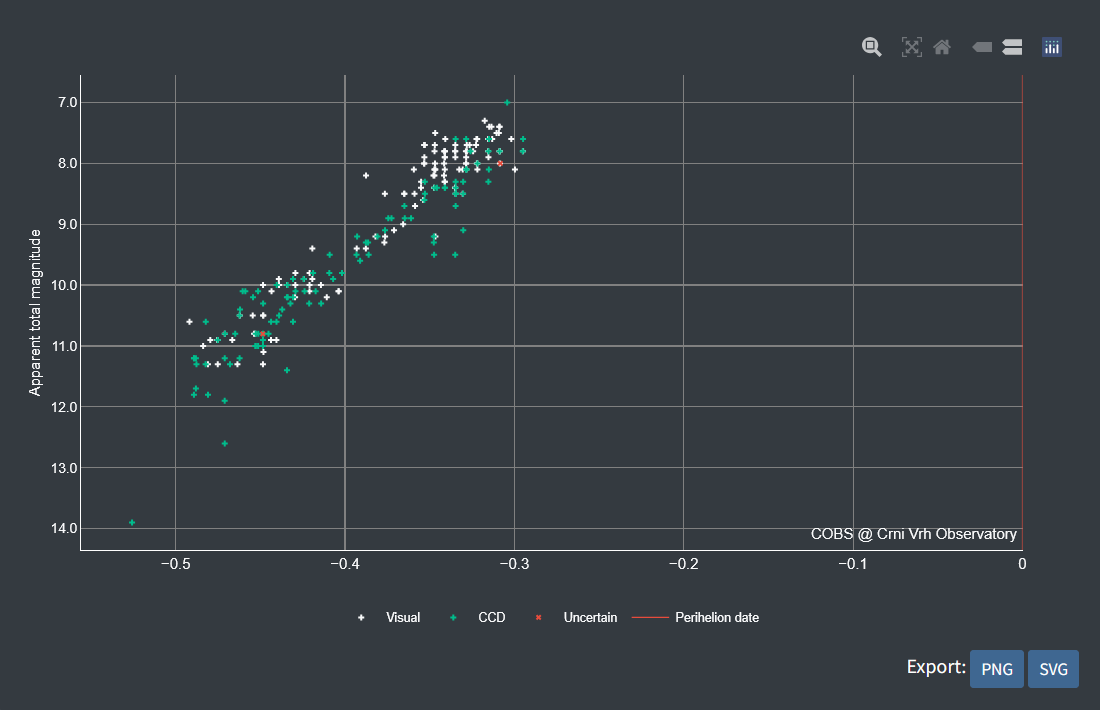
Figure 6. Observations of comet C/2025 A6 (Lemmon) plotted against heliocentric distance [AU].
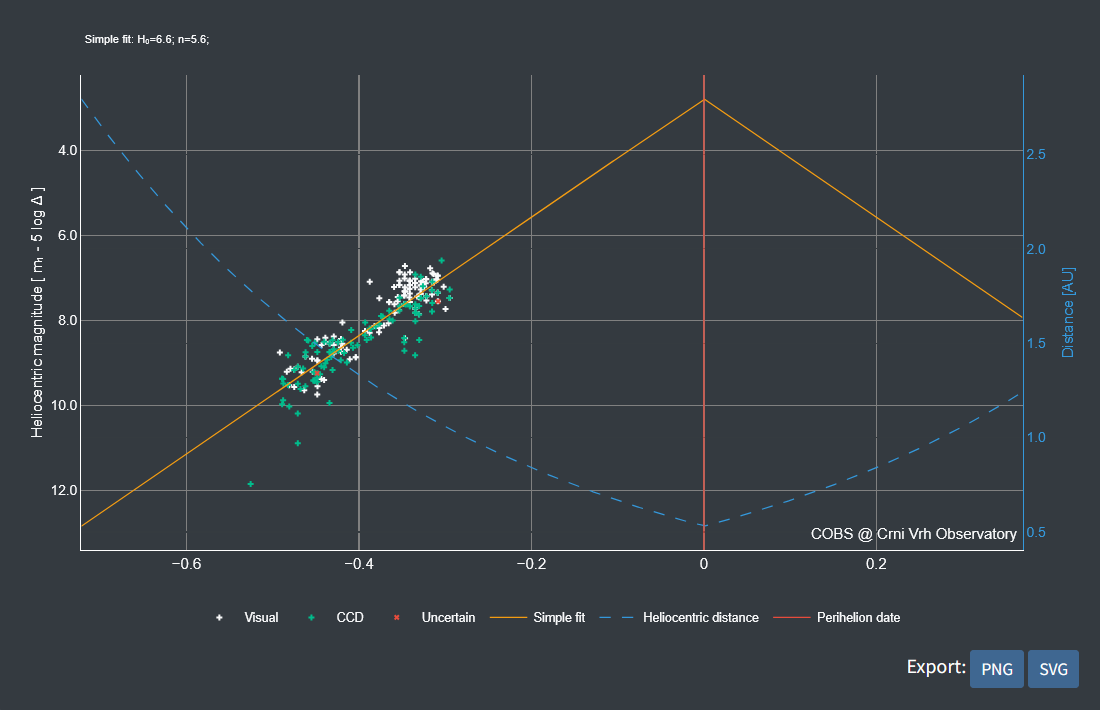
Figure 7. Heliocentric magnitude of comet C/2025 A6 (Lemmon) against heliocentric distance [AU], with a simple lightcurve fit and heliocentric distance trend.