The Comet Observation Database - Observer tools and case study (EPSC2018-644, Berlin 2018)
This paper introduces the main functionality of the COBS database [1, 2] that is of interest to a comet observer, with application to C/2004 R2 (Machholz).
Introduction
COBS is one of the most complete databases of comet observations available, containing 235,000 observations from 1884 onwards. Among its capabilities are data filtering, display and analysis, including user specific functions.
Submission and editing observations
The Observation page provides three web form options for observation submission. Individual visual and CCD observations may be submitted via individual text fields and radio buttons while preformatted ICQ observation strings [3] may be submitted individually or as a list.
The My Obs page (accessible after login) provides access to observations made by the observer. Observations may be edited and downloaded in ICQ format, irrespective of how they were originally entered.
Observation display and analysis
The database may be queried freely. On the Analysis page the following parameters are selectable:
- Comet
- Time period
- Type of data: visual, CCD
- Plot parameters: magnitude, coma diameter, tail length, tail positional angle, degree of condensation
- Source: observer, association, country
- Data display: data table, figure with plotted observations, figure with data from a specific source (observer, association or country) highlighted
- Analysis type: best-fit light-cruve parameters H0 and n, perihelion date
The number of observations retrieved from the database are presented together with the number of observations made by the source, if one is selected. Negative or uncertain data may be excluded from the plot.
The table of observations may be downloaded as ICQ format text file and the plot may be saved to an SVG file. The result page can be accessed directly and shared by a specific URL.
Recent comet magnitudes
This module is accessible on the main page and lists the most recent observations in chronological order. It is linked to a page listing the observations made during the last month.
Current comet magnitudes
This module lists the present comets brighter than visual or V-band magnitude 14. For each comet presently observable, the magnitude trend, latitude range where it is observable, and the optimum observing time for latitudes 45 N and 45 S are given.
Magnitudes and trends are based on an analysis of the observations submitted to COBS. Magnitudes based on MPC light curve parameters are given if the comet has not been observed during the last 30 days.
Comet Observing Planner
With this tool the user can generate a detailed list of observable comets for a given observing session. Input is an observation interval, comet magnitude, altitude limits and minimum distances to the Sun and the Moon.
On the result page, observable comets are listed in order of optimum observing time. For each comet, the magnitude and trend based on COBS data, coordinates, apparent motion and more are shown. If the user is logged in, rise, transit and set times and transit altitude are calculated for the observing location set in the user profile, otherwise the times are calculated for Črni Vrh Observatory, Slovenia.
The MPC 1-line orbital elements [4] of the observable comets can be downloaded as a text file. The list can be used in telescope control programs to create and setup automated patrol scripts.
Observation statistics
The Statistics page provides a number of tables detailing the present content of the database. The most frequently observed comets are tabulated in order of total number of observations, followed by the most active observers, associations and countries.
The database is also broken down into individual years, with the total number of observations, visual and photometric observations for each year. Links on the statistics pages provides access to the observations made in a specific year, for a specific comet, or by a specific observer, association or country.
Case study
Four plots of comet C/2004 R2 (Machholz) are shown below to illustrate the display capability of COBS (Figure 1 and 2).
This comet has 4,702 observations (all visual) between 2004 December 10 and 2005 May 12. The plots show the presence of the full Moon as gaps in the temporal coverage. The 55 observations contributed by the Swedish Amateur Astronomical Society (SAAF) are highlighted. In addition to these plot types, also the degree of condensation of the coma (DC value) may be plotted.
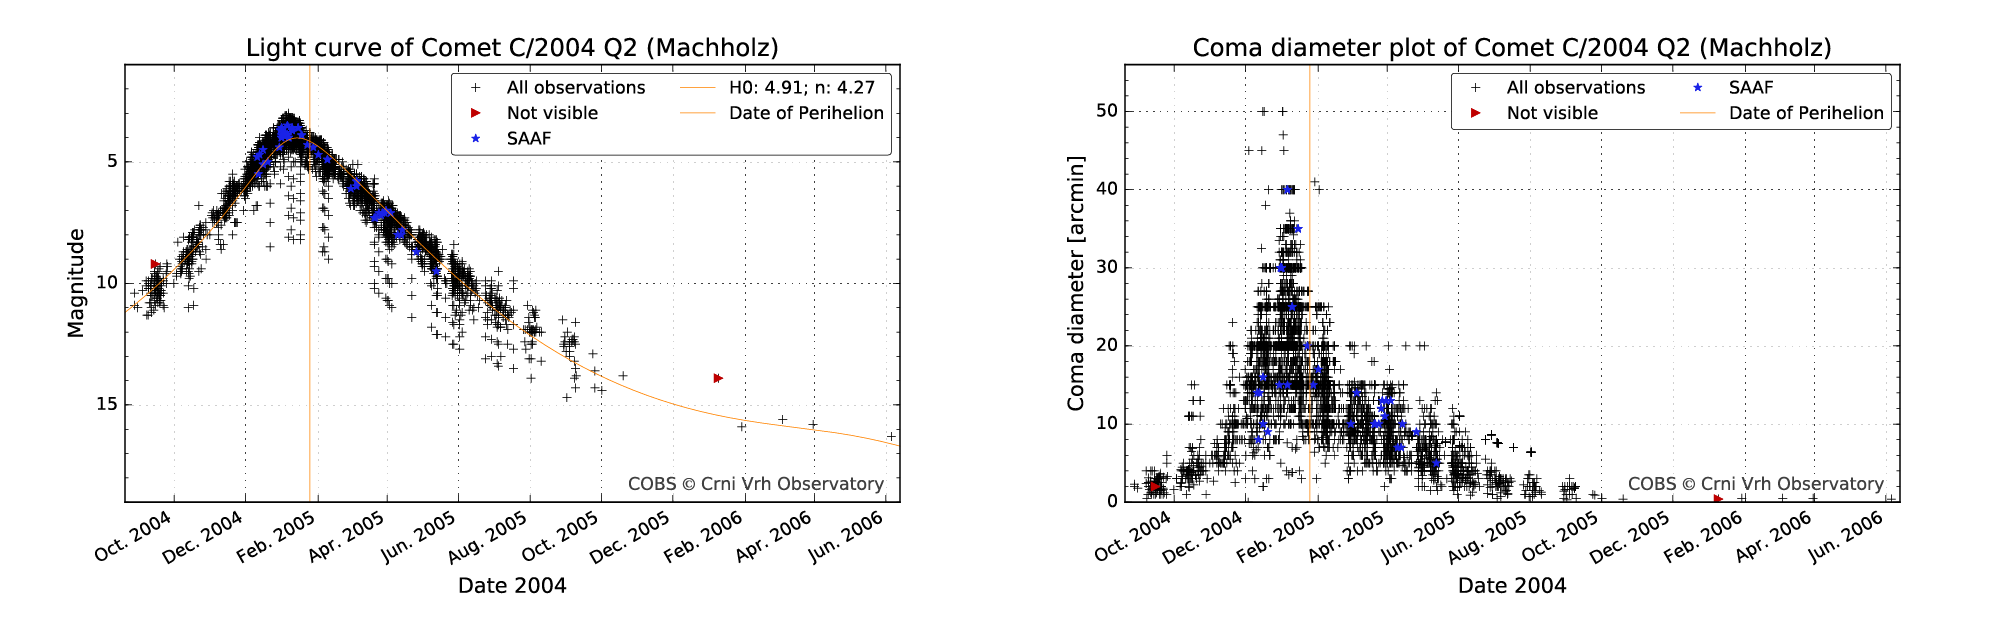
Figure 1: Magnitude with best fit light curve and date of perihelion over plotted (left) and coma diameter (right) of comet C/2004 Q2 (Machholz). The maximum coma diameter was over 40 arc minutes. SAAF observations are shown as blue stars, negative observations as red triangles.
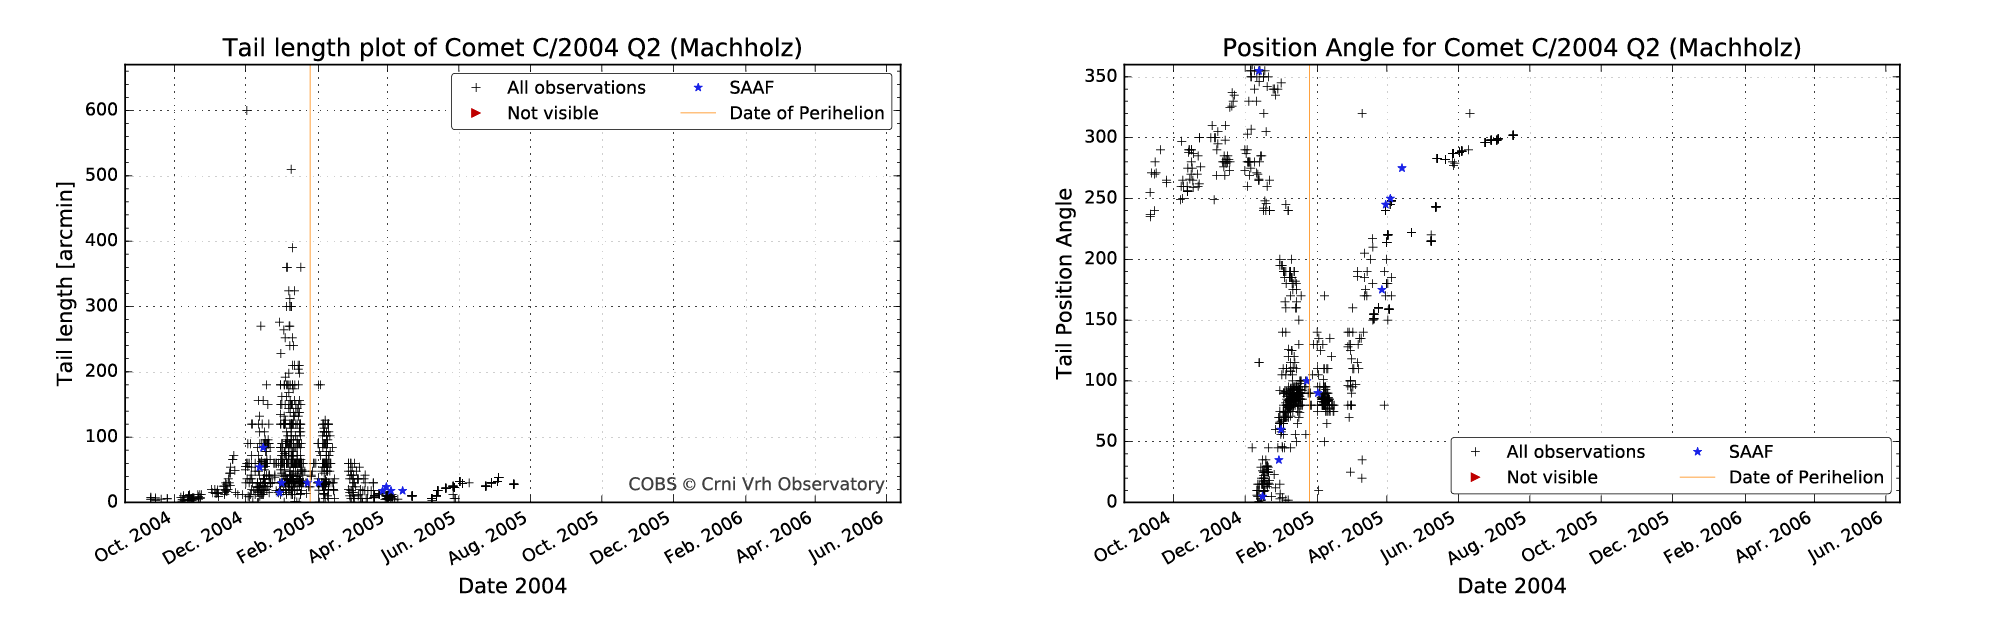
Figure 2: Tail length (left) and tail position angle (right) of comet C/2004 Q2 (Machholz). The tail revolved a full 360 degrees throughout the apparition. The maximum tail length was 7 degrees. SAAF observations are shown as blue stars.
References
- COBS database. Available at: https://www.cobs.si
- Zakrajšek, J. and Mikuž, H.: Comet Observation database (COBS), BAA Journal (accepted for publication)
- International Comet Quarterly. Available at: http://www.icq.eps.harvard.edu/index.html
- MPC Minor Planet and Comet Ephemeris Service. Available at: https://www.minorplanetcenter.net/iau/ MPEph/MPEph.html
- Zakrajšek, J., Mikuž, H. and Warell, J.: The Comet Observation Database: Structure and content. European planetary Science Congress 632, 2018